

Data sourced from SnapStats Publishing.
Data sourced from SnapStats Publishing. North Vancouver Real Estate Market Update September 2019
September Market Update
This is the price analysis for Septmeber 2019 in North Vancouver. It includes detailed information on detached homes, attached condos and townhomes. Check out the current market trends!
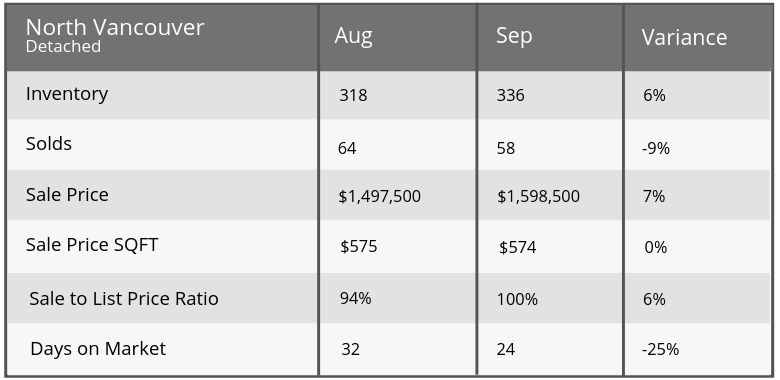
DETACHED
- Market Type Indicator NORTH VANCOUVER DETACHED: Balanced Market at 17% Sales Ratio average (1.7 in 10 homes selling rate)
- Homes are selling on average 100% below list price
- Most Active Price Band**$1 mil to $1.25 mil with average 56% Sales Ratio (Sellers market)
- Buyers BestBet** Homes between $2.5 mil to $2 mil, Dollarton, Edgemont and minimum 7 bedroom properties
- Sellers Best Bet** Selling homes in Blueridge, Canyon Height, Lynn Valley and up to 2 bedroom properties
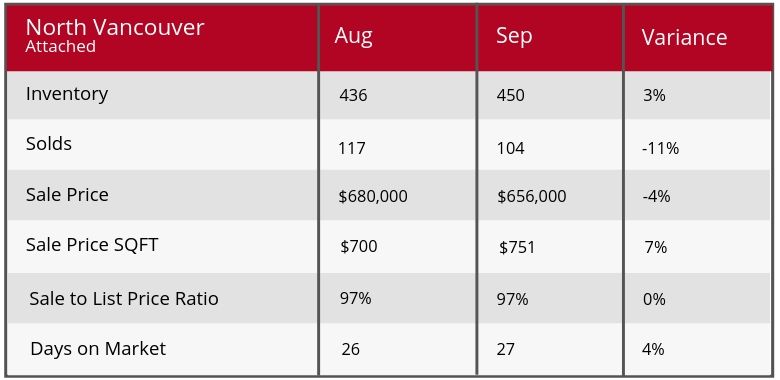
Attached
- Market Type Indicator NORTH VANCOUVER ATTACHED:Sellers Market at 23% Sales Ratio average (2.3 in 10 homes selling rate)
- Homes are selling on average 3% below list price
- Most Active Price Band** $400,000 to $500,000 with average 46% Sales Ratio (Sellers market)
- Buyers Best Bet** Homes between $1.25 mil to $1.5 mil, Lynnmour, Mosquito Creek, Pemberton and minimum 4 bedrooms
- Sellers Best Bet**Selling homes in Edgemont, Lynn Valley and up to 2 bedroom properties