

Data sourced from SnapStats Publishing.
Data sourced from SnapStats Publishing. North Vancouver Real Estate Market Update August 2019
August Market Update
This is the price analysis for August 2019 in North Vancouver. It includes detailed information on detached homes, attached condos and townhomes. Check out the current market trends!
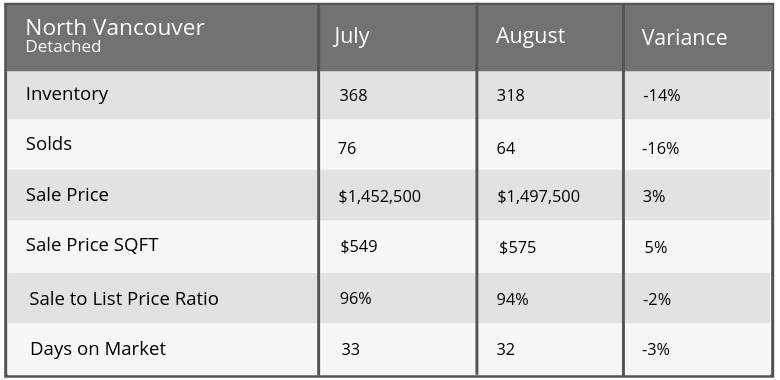
DETACHED
- Market Type Indicator NORTH VANCOUVER DETACHED: Balanced Market at 20% Sales Ratio average (2 in 10 homes selling rate)
- Homes are selling on average 6% below list price
- Most Active Price Band**$1 mil to $1.25 mil with average 64% Sales Ratio (Sellers market)
- Buyers BestBet** Homes between $2 -$2.25 mil/ $2.75 -$3 mil, Dollarton and minimum 7 bedroom properties
- Sellers Best Bet** Selling homes in Blueridge, Deep Cove, Forest Hills and up to 2 bedroom properties
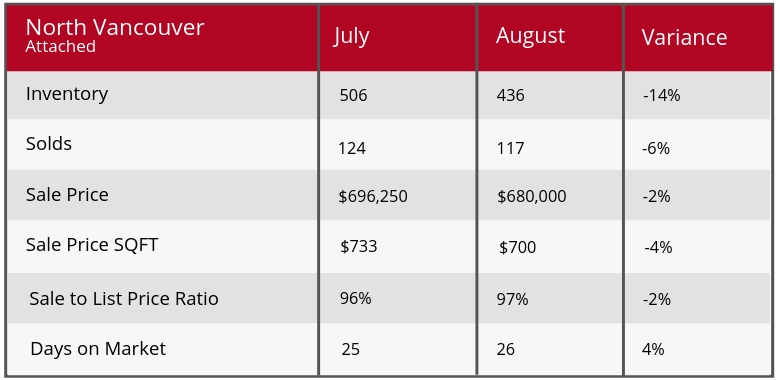
Attached
- Market Type Indicator NORTH VANCOUVER ATTACHED:Sellers Market at 27% Sales Ratio average (2.7 in 10 homes selling rate)
- Homes are selling on average 3% below list price
- Most Active Price Band**$300,000 to $400,000 /$500,000 to $600,000 with average 43% Sales Ratio (Sellers market)
- Buyers Best Bet** Homes between $1.25 mil to $1.5 mil, Lynnmour, Pemberton and minimum 4 bedroom properties
- Sellers Best Bet**Selling homes in LynnValley, Norgate, Northlands, UpperLonsdale and 3 bedroom properties