

Data sourced from SnapStats Publishing.
Data sourced from SnapStats Publishing. North Vancouver Real Estate Market Update February 2020
February Market Update
This is the price analysis for February 2020 in North Vancouver. It includes detailed information on detached homes, attached condos and townhomes. Check out the current market trends!
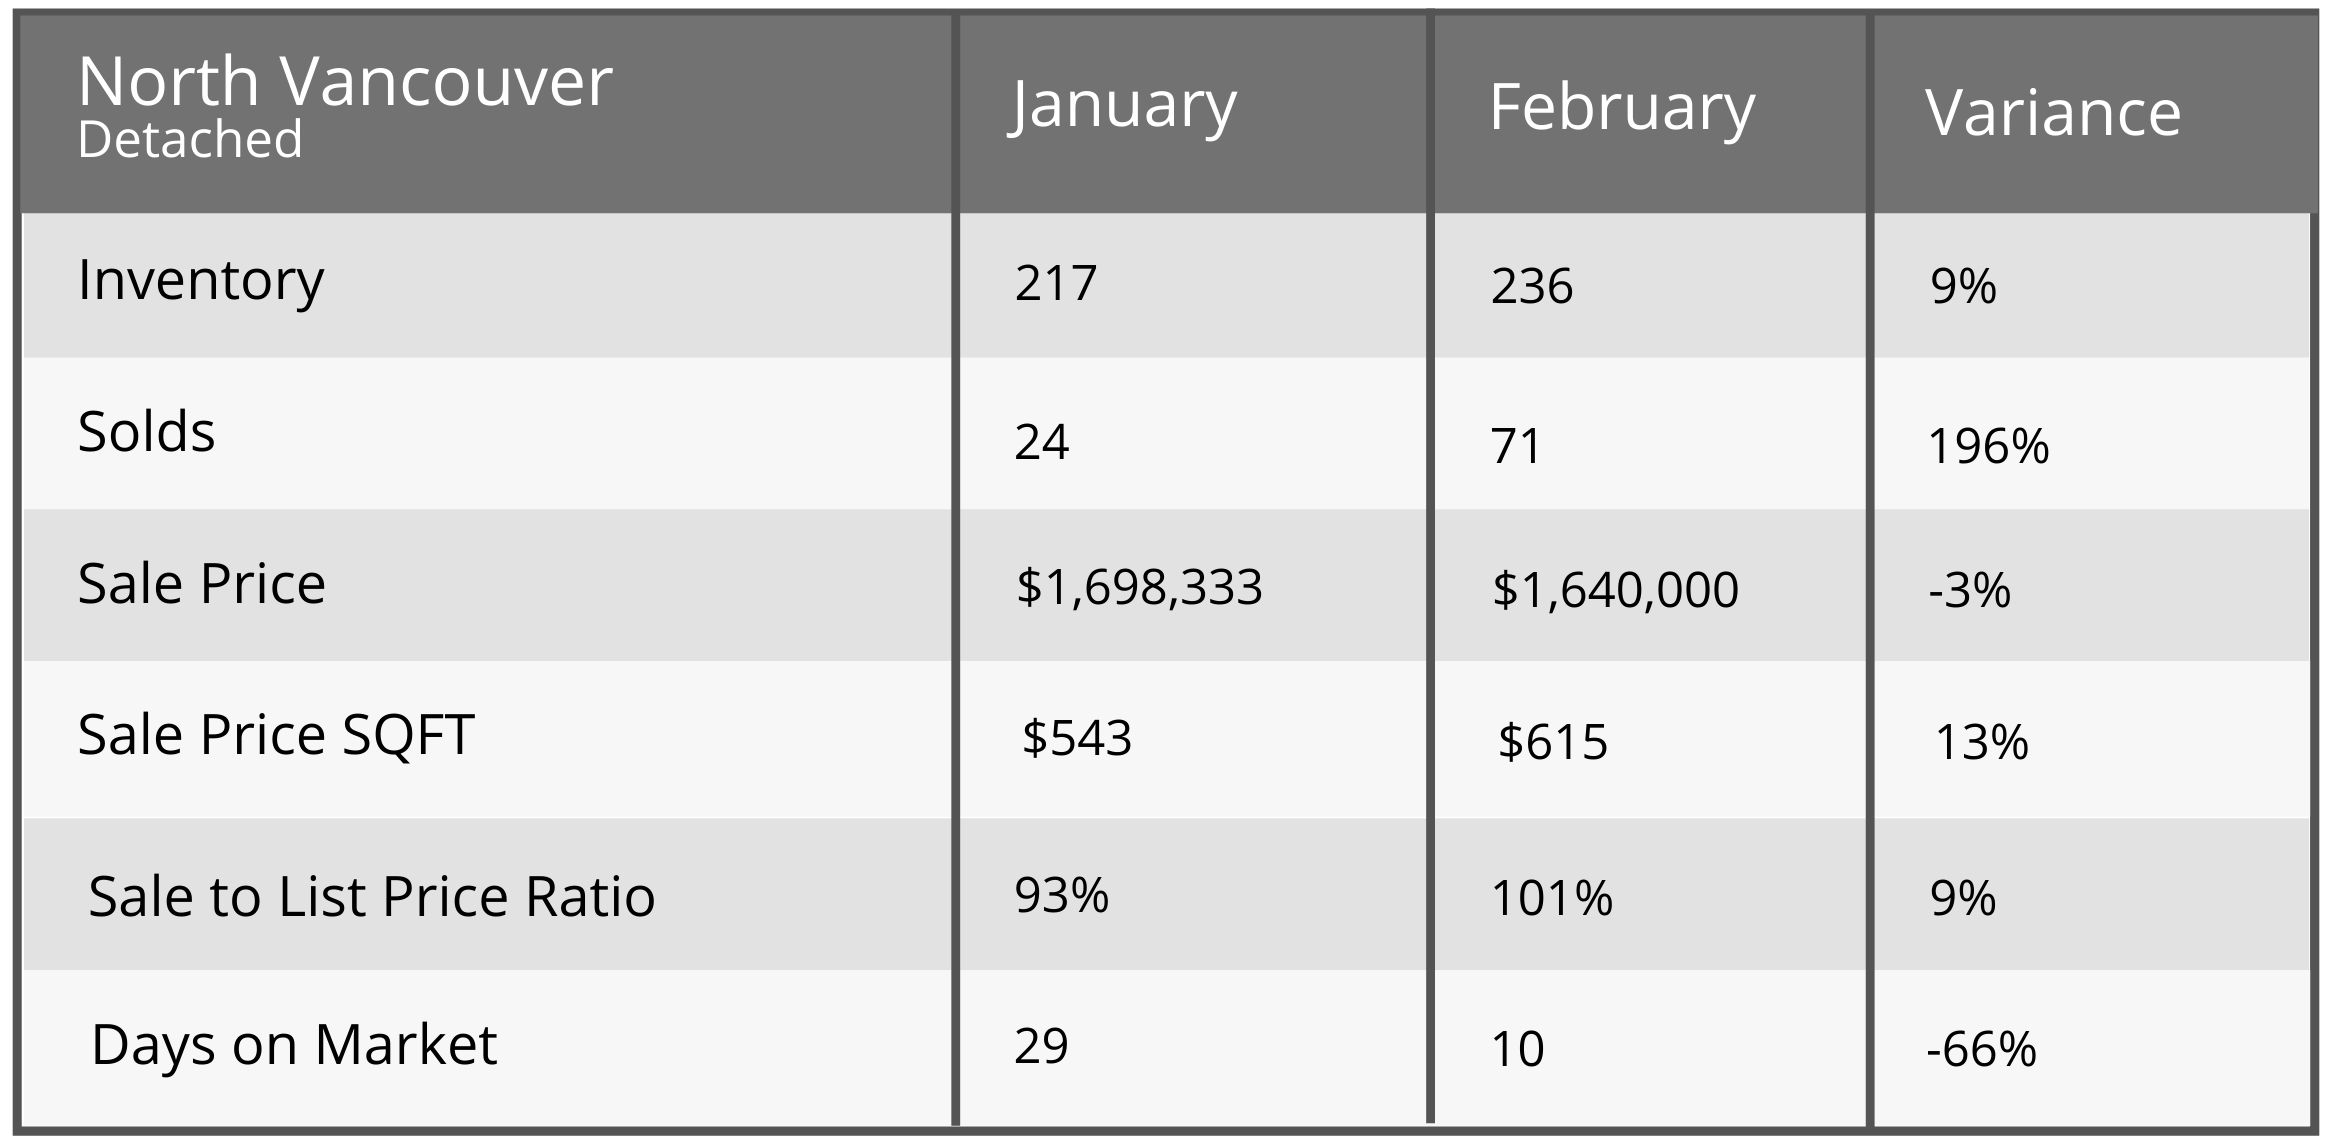
DETACHED
- Market Type Indicator NORTH VANCOUVER DETACHED: Sellers Market at 30% Sales Ratio average (3 in 10 homes selling rate)
- Homes are selling on average 1% above list price
- Most Active Price Band** $1.25 mil to $1.5 mil with average 67% Sales Ratio (Sellers market)
- Buyers Best Bet** Homes between $3 mil to $3.5 mil, Dollarton, Edgemont and minimum 7 bedroom properties
- Sellers Best Bet** Selling homes in Blueridge, Central Lonsdale, Lynn Valley and 3 to 4 bedroom properties
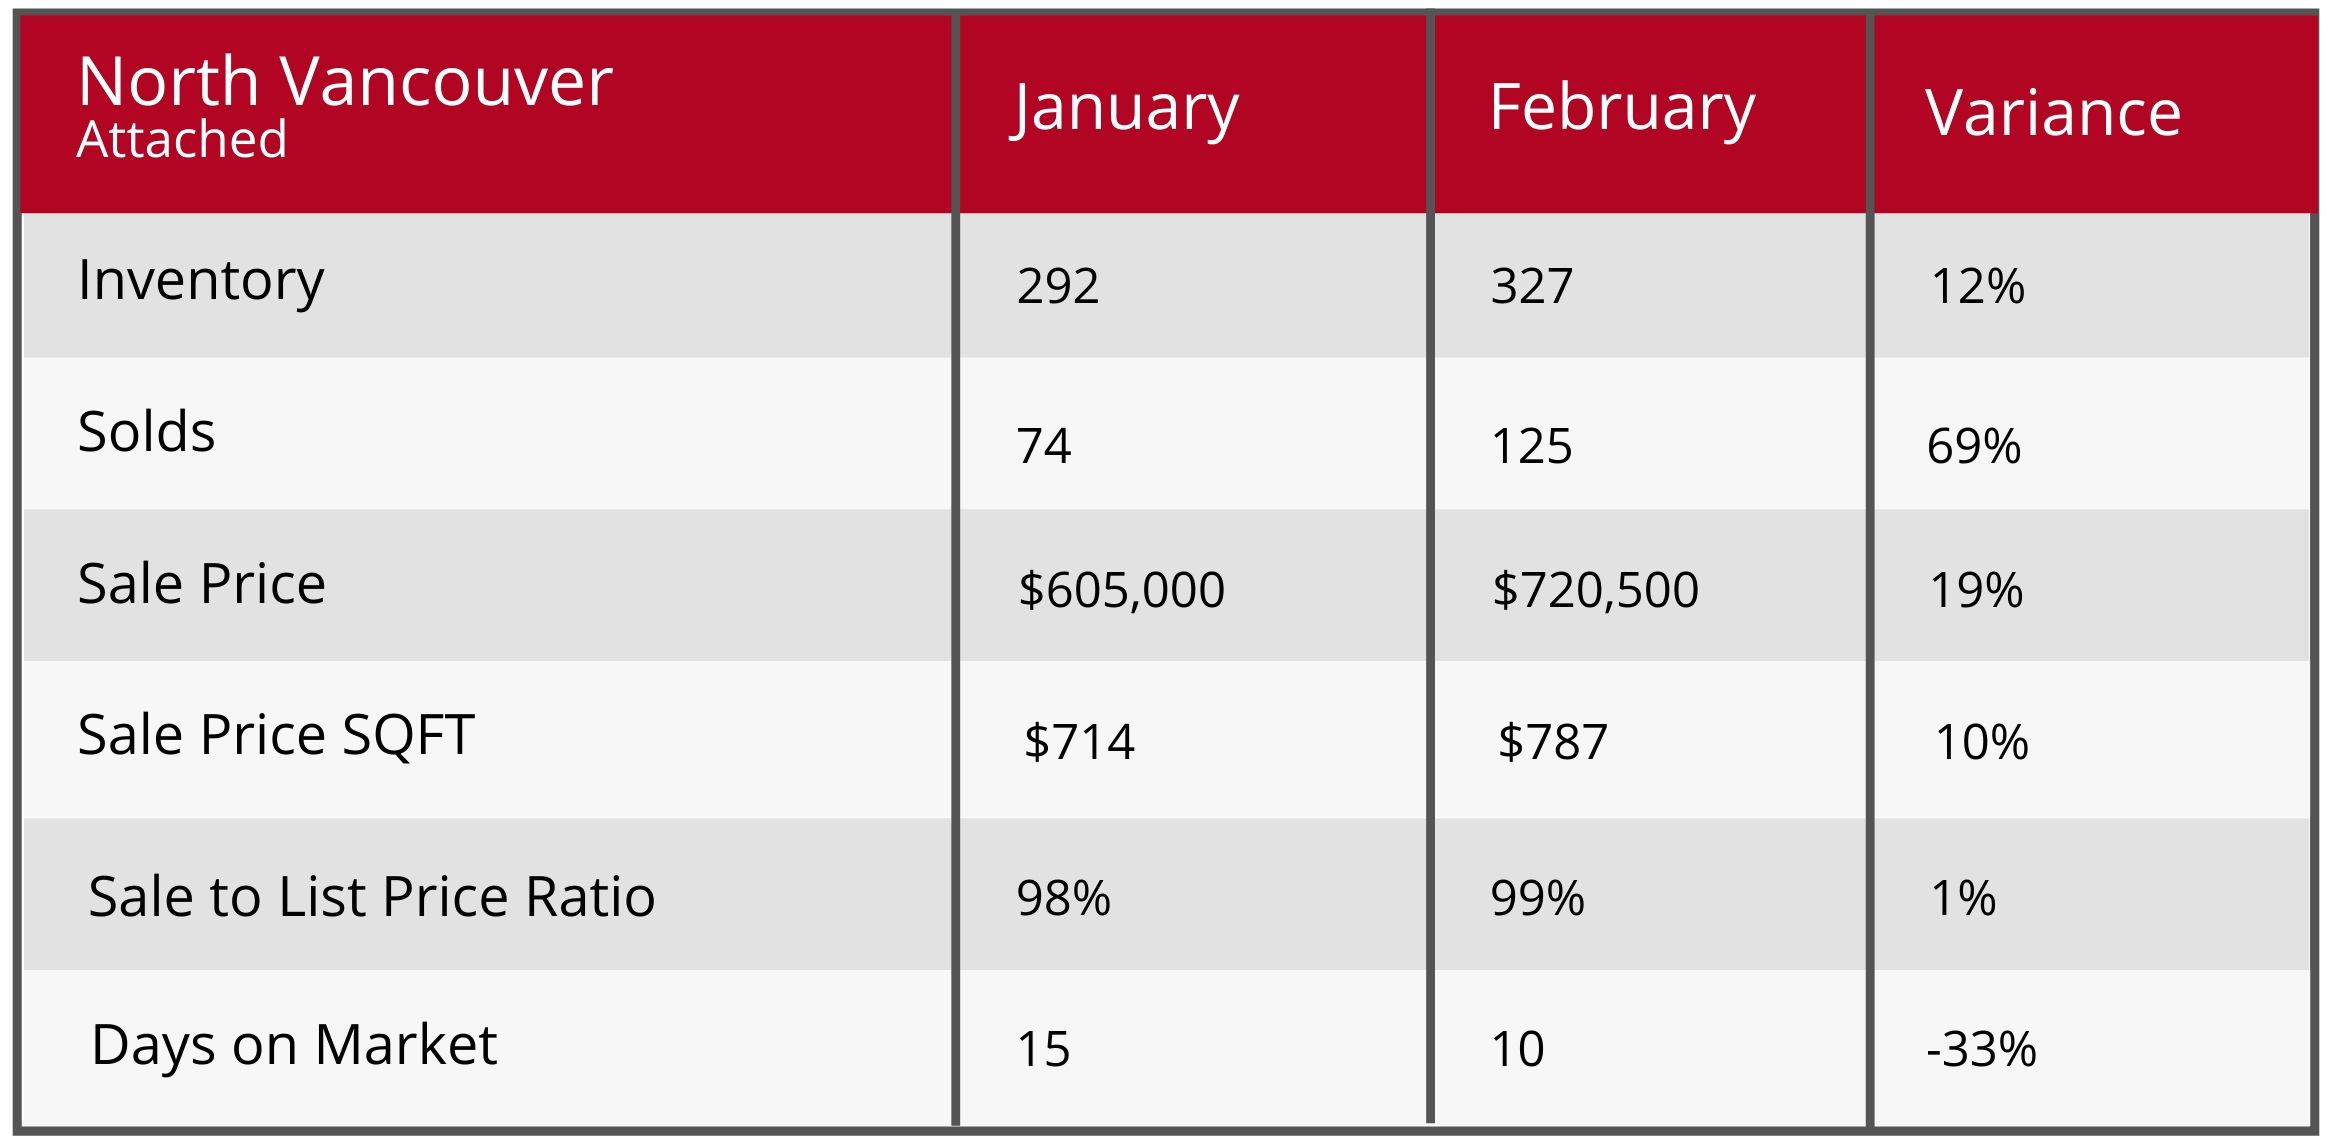
ATTACHED
- Market Type Indicator NORTH VANCOUVER ATTACHED: Sellers Market at 38% Sales Ratio average (3.8 in 10 homes selling rate)
- Homes are selling on average 1% below list price
- Most Active Price Band** $400,000 to $500,000 with average 81% Sales Ratio (Sellers market)
- Buyers Best Bet** Homes between $1.5 mil to $1.75 mil, Lynnmour, Mosquito Creek and minimum 4 bedroom properties
- Sellers Best Bet** Selling homes in Lynn Valley, Pemberton, Upper Lonsdale and up to 1 bedroom properties