January Market Update
This is the price analysis for January 2018 in North Vancouver. It includes detailed information on detached homes, attached condos and townhomes. Check out the current market trends!
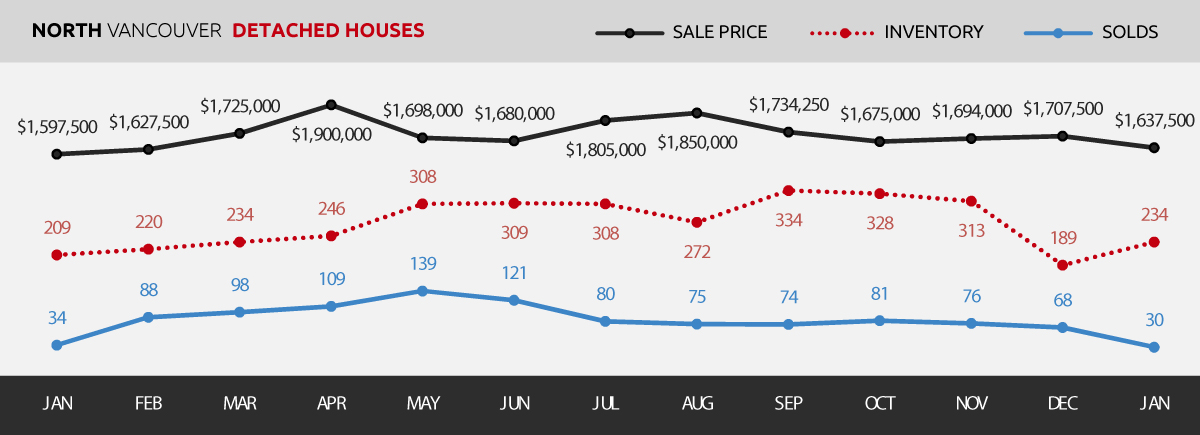
DETACHED
- Sellers market at 13% Sales Ratio average (1.3 in 10 homes selling rate)
- Homes are selling on average at list price
- Most Active Price Band**$1.25 mil to $1.5 mil with average 32% Sales Ratio (Sellers market speed)
- Buyers Best Bet**Homes between $2.5 mil to $2.75 mil, Edgemont and 5 to 6 bedroom properties
- Sellers Best Bet**Selling homes in Upper Lonsdale and up to 2 bedroom properties
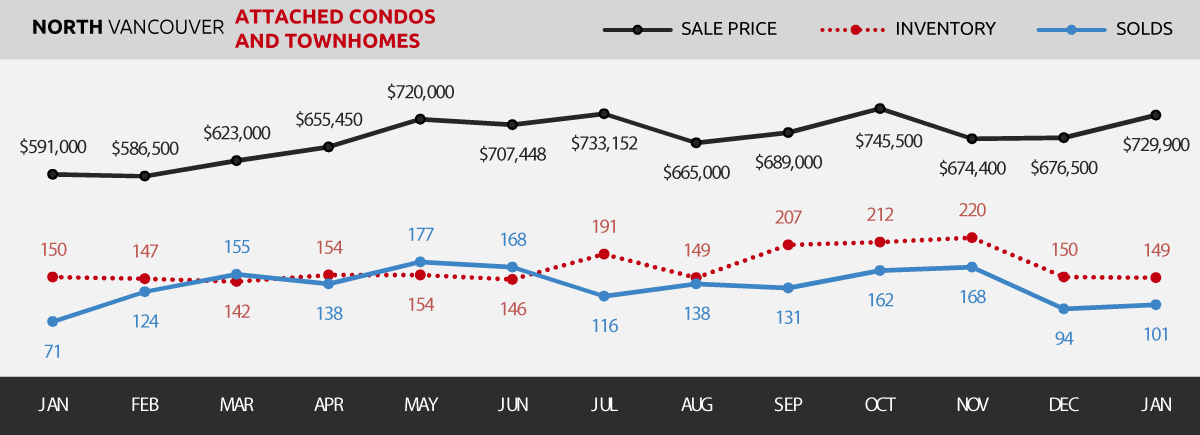
Attached
- Sellers market at 68% Sales Ratio average (6.8 in 10 homes selling rate)
- Homes are selling on average 1% below list price
- Most Active Price Band**$400,000 to $700,000 with average >100% Sales Ratio (Sellers market speed)
- Buyers Best Bet** Homes between $1 mil to $1.25 mil, Northlands and 5 to 6 bedroom properties
- Sellers Best Bet**Selling homes in Lynn Valley and up to 2 bedroom properties