

Data sourced from SnapStats Publishing.
Data sourced from SnapStats Publishing. North Vancouver Real Estate Market Update March 2021
North Vancouver Real Estate Market Update – March
This is the price analysis for March 2021 in North Vancouver. It includes detailed information on detached homes, attached condos and townhomes. Check out the current market trends!
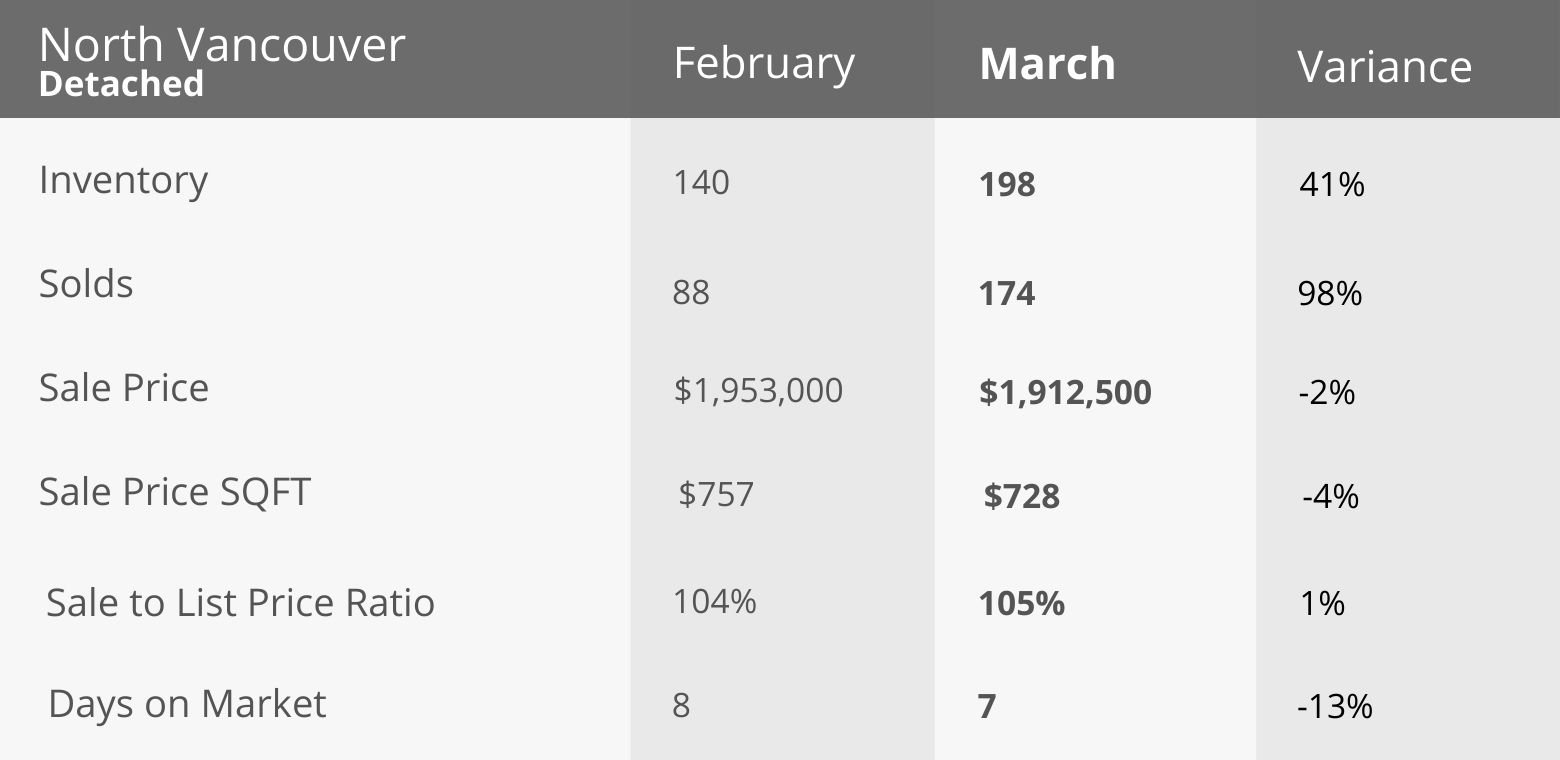
DETACHED
- Market Type Indicator NORTH VANCOUVER DETACHED: Sellers Market at 88% Sales Ratio average (8.8 in 10 homes selling rate)
- Homes are selling on average 5% above list price
- Most Active Price Band** $1.5 mil to $1.75 mil with average >100% Sales Ratio (Sellers market)
- Buyers Best Bet** Homes between $3.5 mil to $4 mil, Deep Cove, Upper Lonsdale and 3 to 6 bedroom properties
- Sellers Best Bet** Selling homes in Boulevard, Calverhill, Canyon Heights, Central Lonsdale, Lynn Valley and up to 2 / 7 plus bedrooms
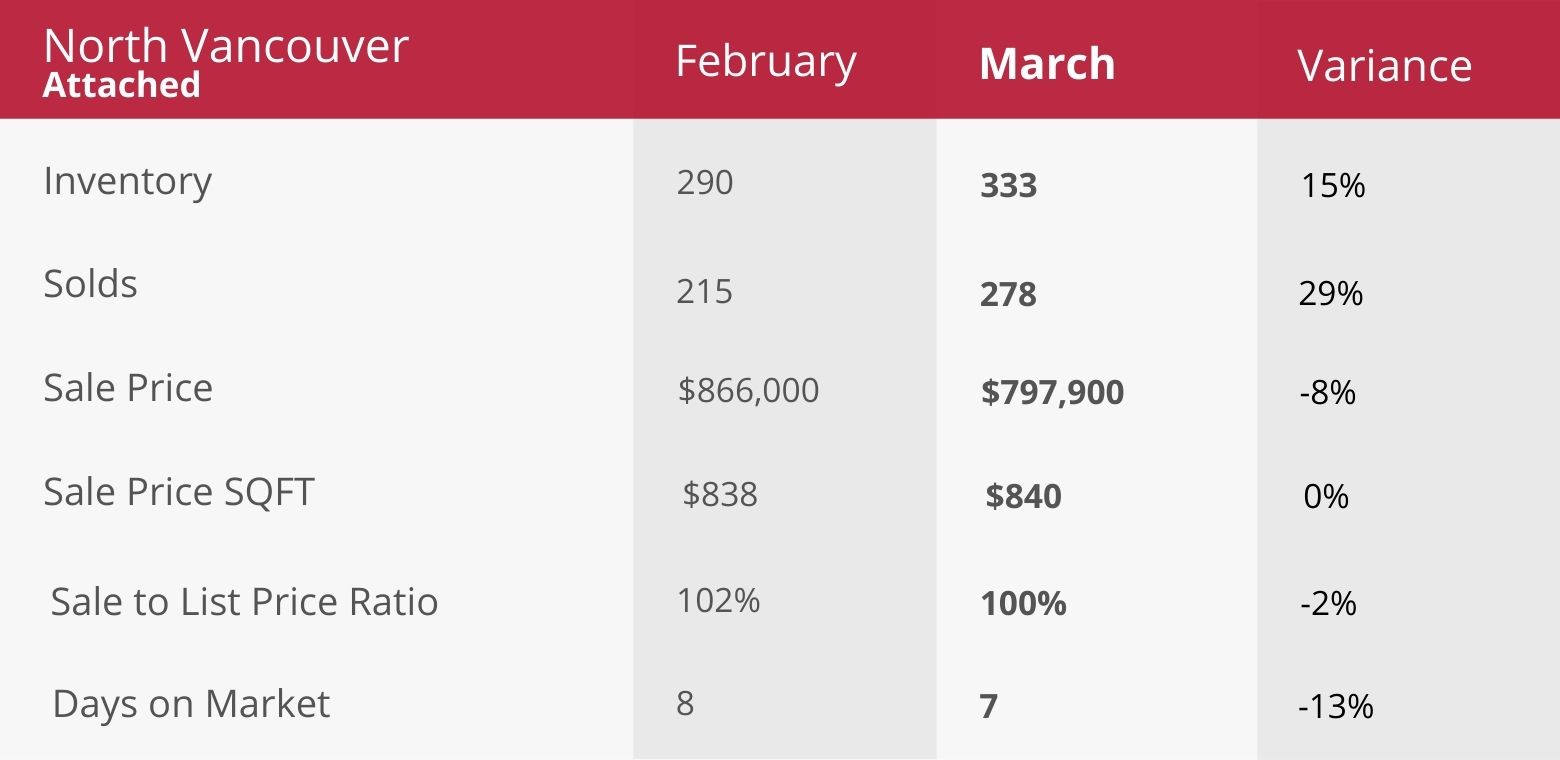
ATTACHED
-
-
- Market Type Indicator NORTH VANCOUVER ATTACHED: Sellers Market at 83% Sales Ratio average (8.3 in 10 homes selling rate)
- Homes are selling on average 100% of list price
- Most Active Price Band** $600,000 to $700,000 with average >100% Sales Ratio (Sellers market)
- Buyers Best Bet** Homes between $1.75 mil to $2 mil, Lynnmour, Norgate, Pemberton, Upper Lonsdale and 3 bedroom properties
- Sellers Best Bet** Selling homes in Lynn Valley, Mosquito Creek, Northlands, Roche Point and up to 1 bedroom properties
-