

Data sourced from SnapStats Publishing.
Data sourced from SnapStats Publishing. North Vancouver Real Estate Market Update March 2023
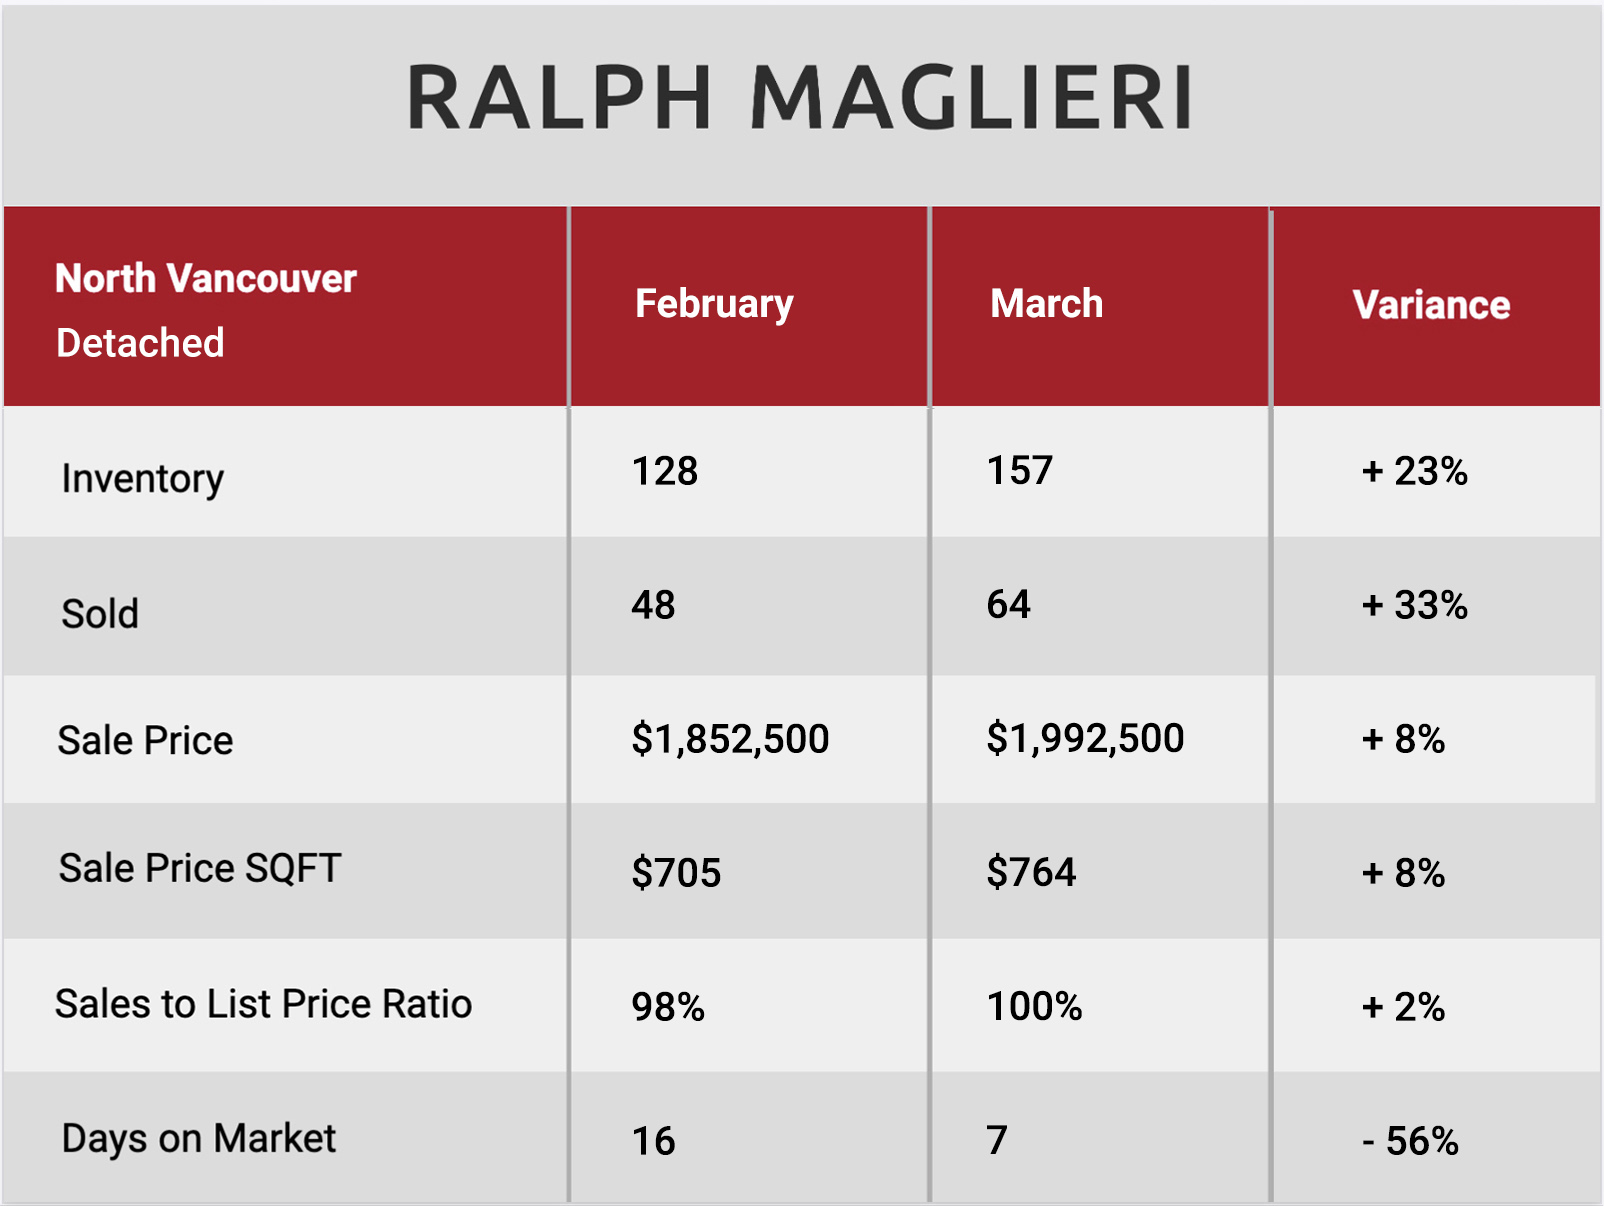
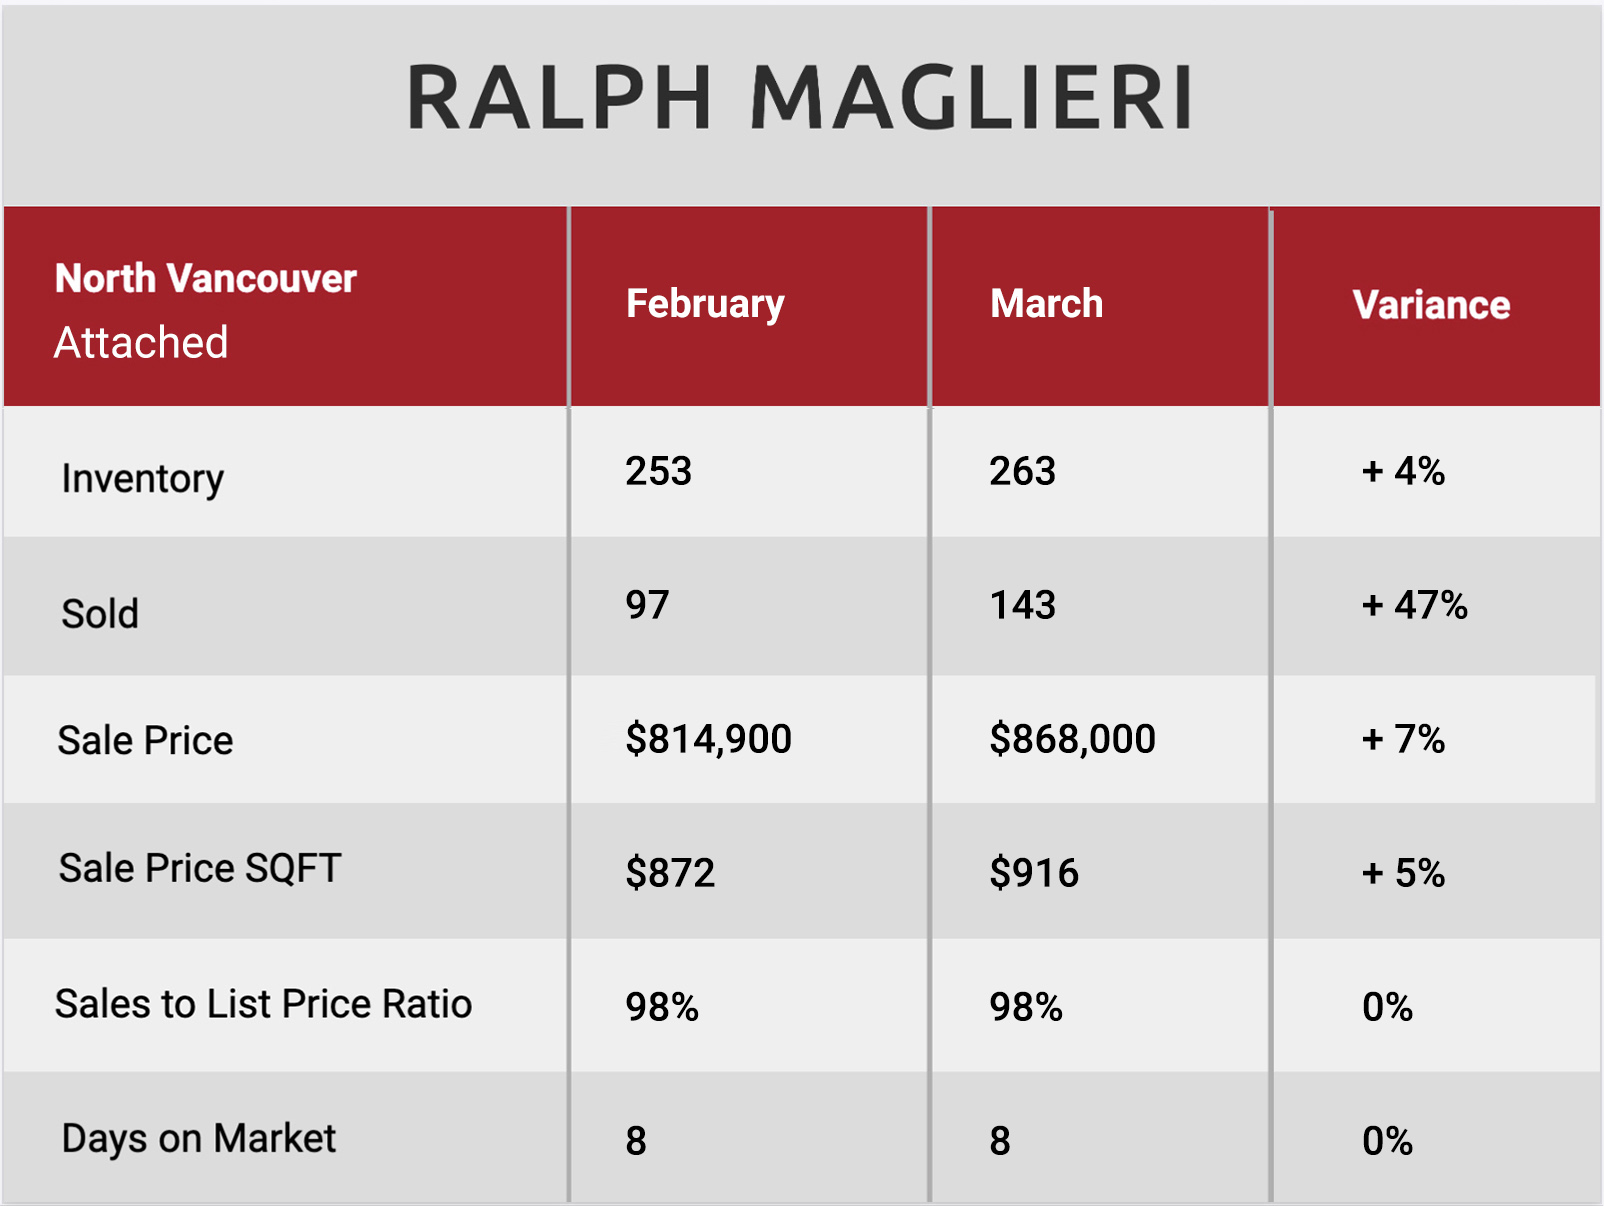
North Vancouver Housing Market Update – March 2023
See below for houses and condos comparison for March 2023 in North Vancouver. View details on most active price bands, sales ratio average, buyers and sellers best bet home values and best selling neighbourhoods in North Vancouver.
DETACHED
- Market Type Indicator NORTH VANCOUVER DETACHED: Sellers Market at 41% Sales Ratio average (4.1 in 10 homes selling rate)
- Homes are selling on average 100% of list price
- Most Active Price Band** $1.5 mil to $1.75 mil with average >100% Sales Ratio (Sellers market)
- Buyers Best Bet** Homes between $3.5 mil to $4 mil, Canyon Heights, Edgemont and minimum 7 bedroom properties
- Sellers Best Bet** Selling homes in Lynn Valley and 3 to 4 bedroom properties
ATTACHED
- Market Type Indicator NORTH VANCOUVER ATTACHED: Sellers Market at 54% Sales Ratio average (5.4 in 10 homes selling rate)
- Homes are selling on average 2% below list price
- Most Active Price Band** $800,000 to $900,000 with average >100% Sales Ratio (Sellers market)
- Buyers Best Bet** Homes between $1.75 mil to $2 mil, Mosquito Creek and up to 1 bedroom properties
- Sellers Best Bet** Selling homes in Lynn Valley, Roche Point and minimum 4 bedroom properties