Data sourced from SnapStats Publishing.
North Vancouver Housing Market Update – November 2021
See below for houses and condos comparison for November 2021 in North Vancouver. View details on most active price bands, sales ratio average, buyers and sellers best bet home values and best selling neighbourhoods in North Vancouver.
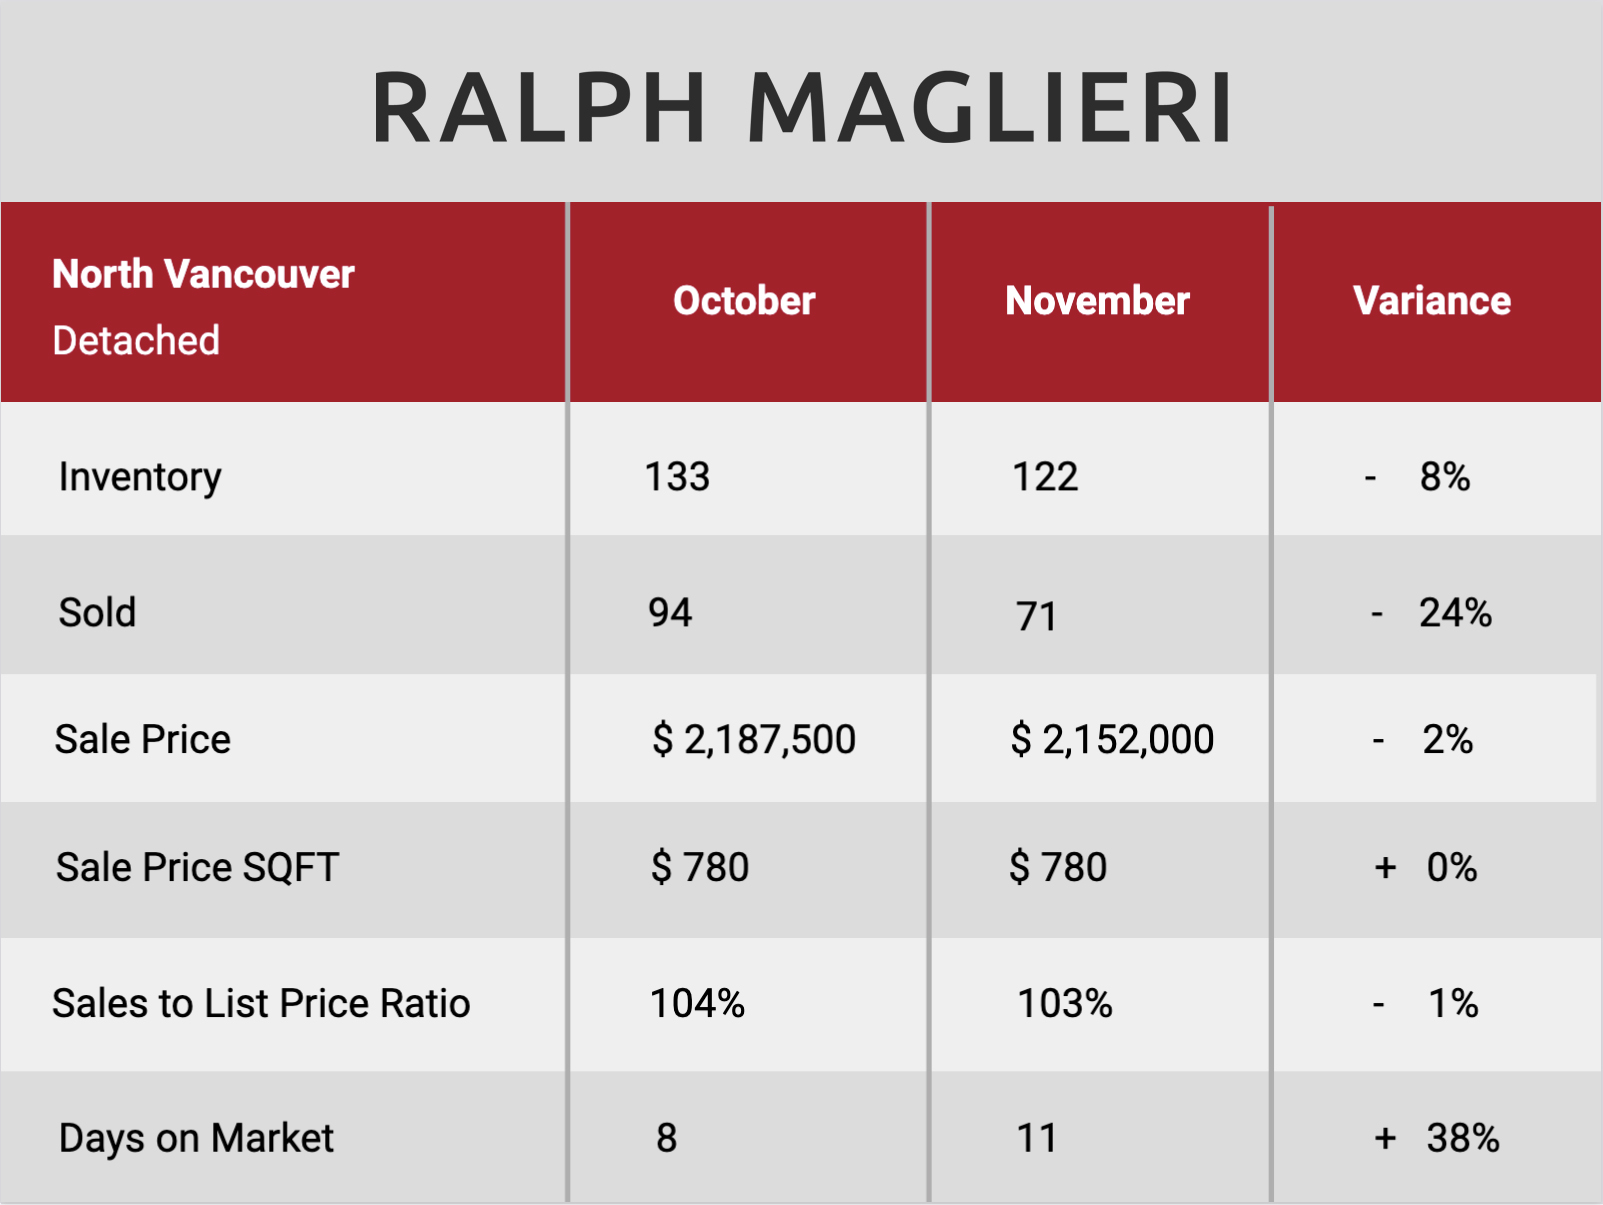
DETACHED
- Market Type Indicator NORTH VANCOUVER DETACHED: Sellers Market at 58% Sales Ratio average (5.8 in 10 homes selling rate)
- Homes are selling on average 3% above list price
- Most Active Price Band**$1.5 mill to $2 mil with average >100% Sales Ratio (Sellers market)
- Buyers BestBet**Homes between $3 mil to $3.5 mil,Dollarton and up to 2 bedroom properties
- Sellers BestBet**Selling homes in Canyon Heights,UpperLonsdale and 5 to 6 bedroom properties
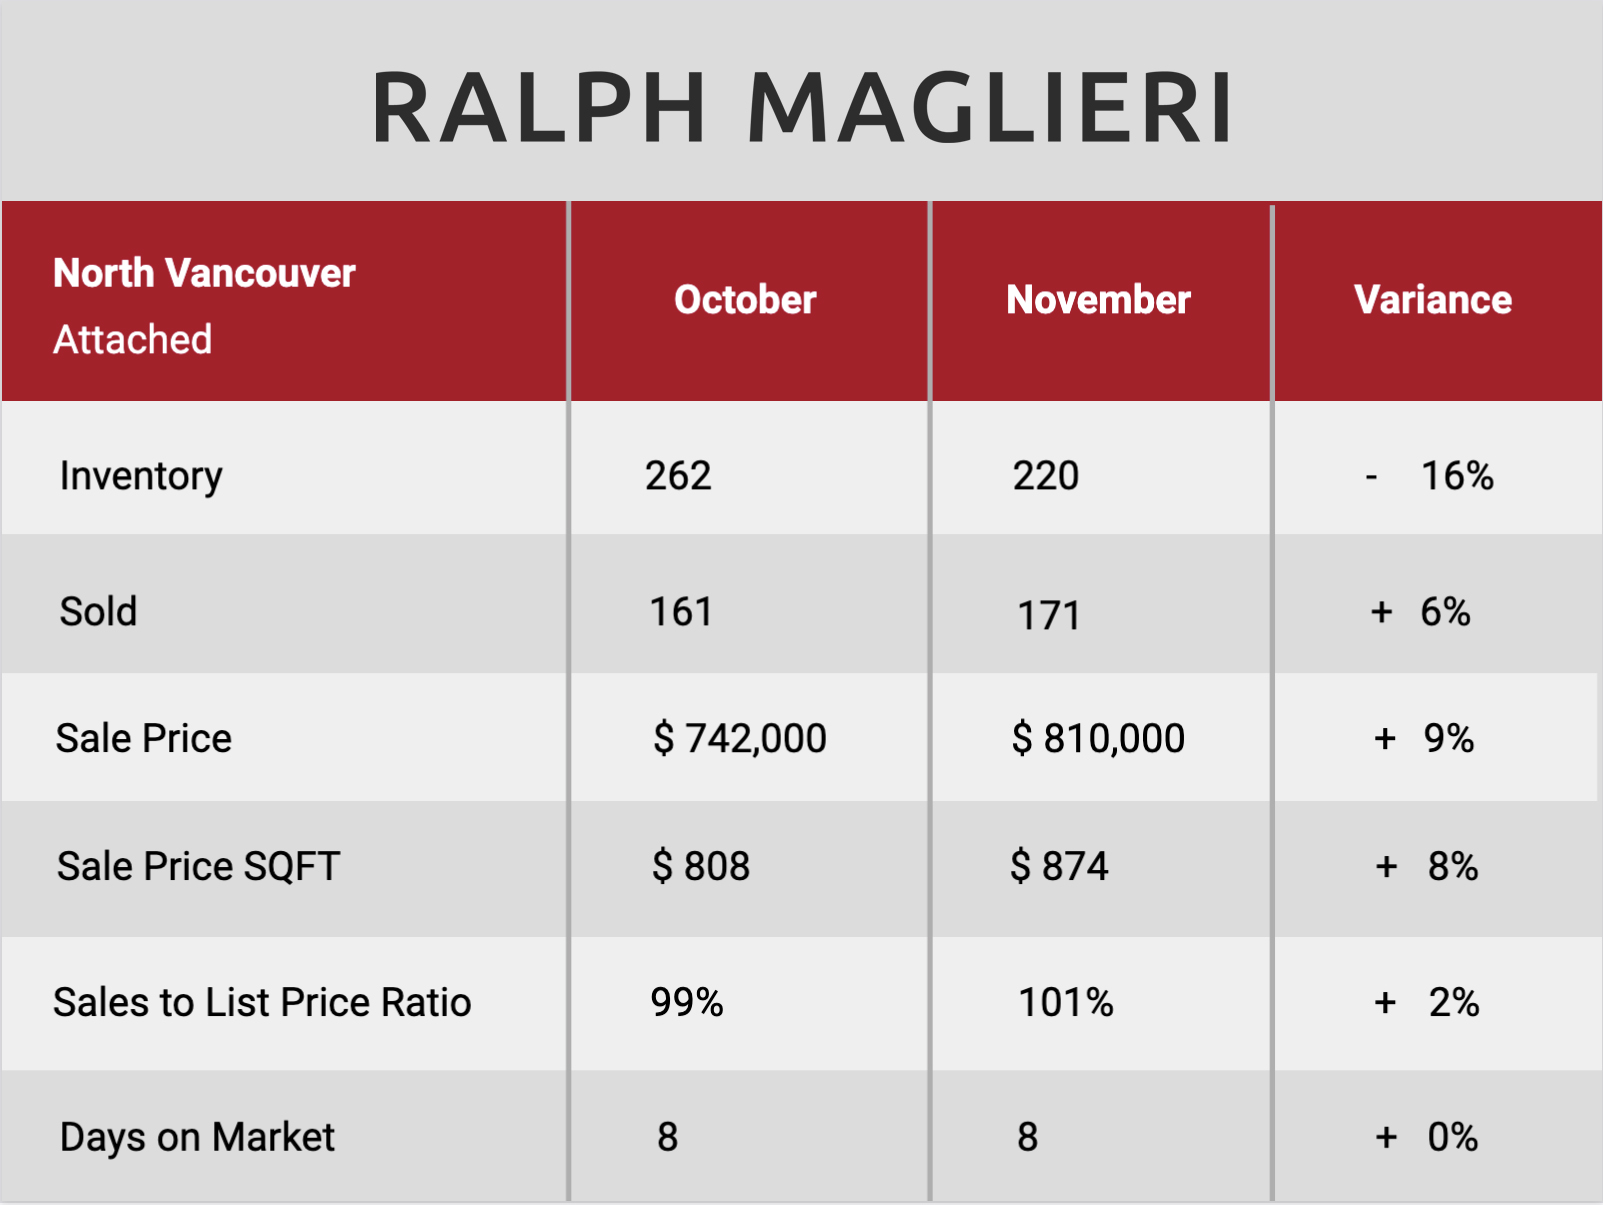
- Market Type Indicator NORTH VANCOUVER ATTACHED: Sellers Market at 78% Sales Ratio average (7.8 in 10 homes selling rate)
- Homes are selling on average 1% above list price
- Most Active Price Band**$800,000 to $900,000 with average >100% Sales Ratio (Sellers market)
- Buyers BestBet**Homes between $1.75 mil to $2 mil, Capilano,Pem berton and 3 bedroom properties
- Sellers BestBet**Selling homes in CentralLonsdale, Lynn Valley, Lynnm our, Roche Pointand up to 1 bedroom properties
ATTACHED