Data sourced from SnapStats Publishing.
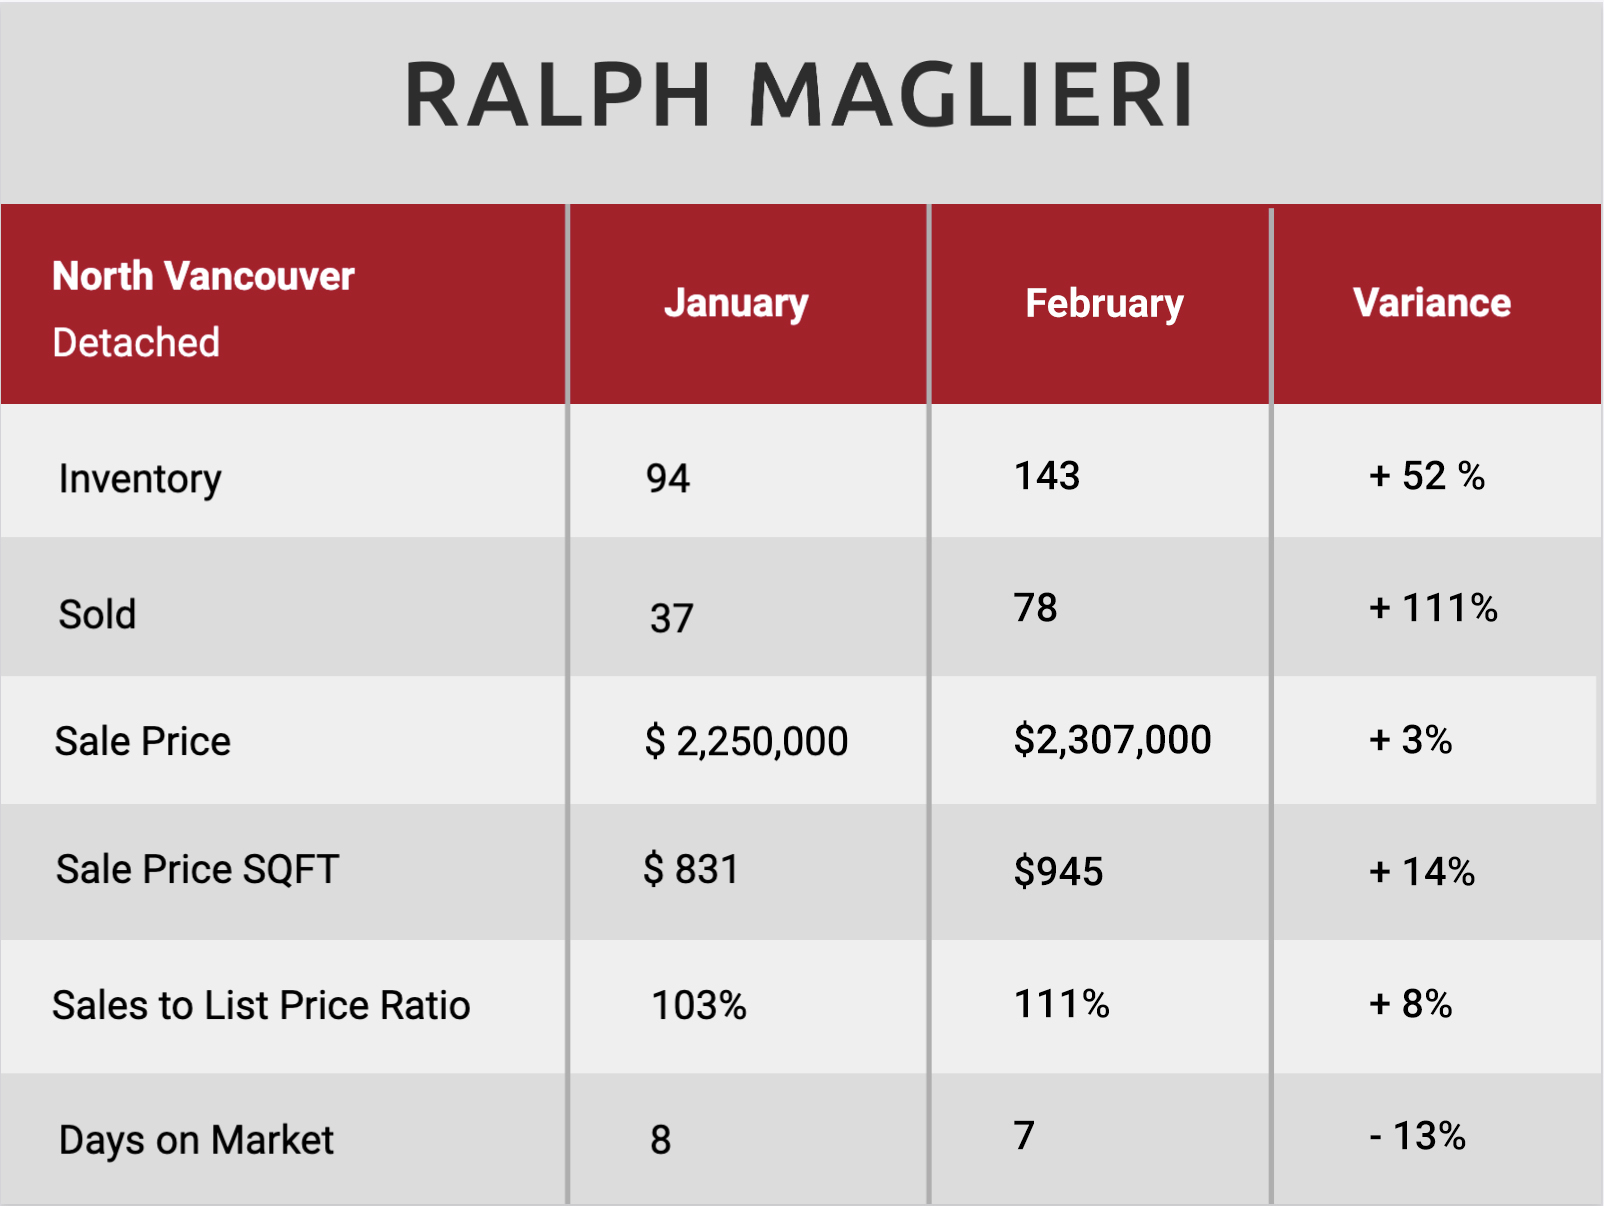
Market Type Indicator NORTH VANCOUVER DETACHED:Sellers Market at 55% Sales Ratio average (5.5 in 10 homes selling rate)
Homes are selling on average 11% above listprice
Most Active Price Band**$2 mil to $2.25 mil $2.5 mil to $2.75 mil with average >100% Sales Ratio (Sellers market)
Buyers BestBet**Homes between $3.5 mil to $4 mil,Boulevard and 5 to 6 bedroom properties
Sellers BestBet**Selling homes in Lynn Valleyand 3 to 4 bedroom properties
North Vancouver Housing Market Update – February 2022
See below for houses and condos comparison for January 2022 in North Vancouver. View details on most active price bands, sales ratio average, buyers and sellers best bet home values and best selling neighbourhoods in North Vancouver.
DETACHED
**With minimum inventory of 10 in most instances
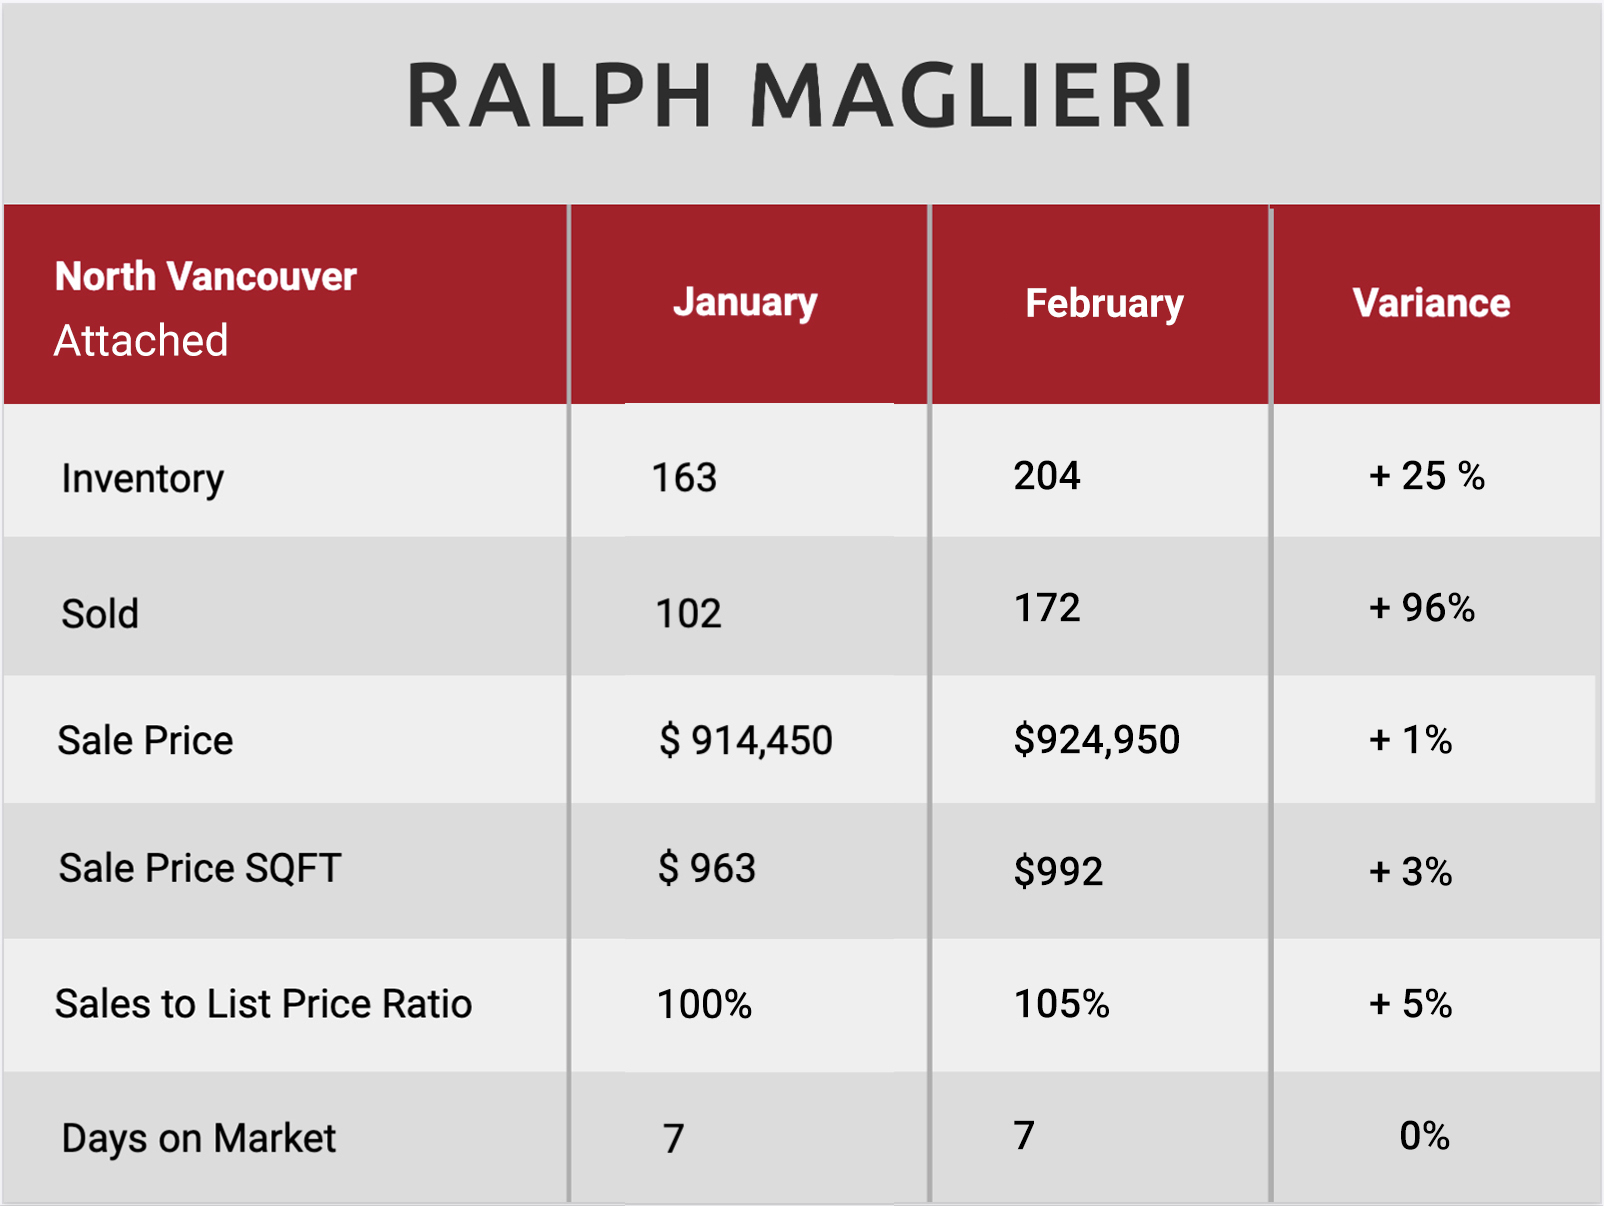
ATTACHED
- Market Type Indicator NORTH VANCOUVER ATTACHED:Sellers Market at 84% Sales Ratio average (8.4 in 10 homes selling rate)
- Homes are selling on average 5% above listprice
- Most Active Price Band**$600,000 to $800,000 /$900,000 to $1.25 mil with average >100% Sales Ratio (Sellers market)
- Buyers BestBet**Hom es between $1.75 mil to $2 mil,Capilano,Pem berton,UpperLonsdale and 3 bedroom s
- Sellers BestBet**Selling homes in CentralLonsdale,Lynn Valley,Lynnm our,M osquito Creek,Roche Pointand up to 1 bedrooms
**With minimum inventory of 10 in most instances