

Data sourced from SnapStats Publishing.
Data sourced from SnapStats Publishing.North Vancouver Real Estate Market Update Nov 2018
November Market Update
This is the price analysis for November 2018 in North Vancouver. It includes detailed information on detached homes, attached condos and townhomes. Check out the current market trends!
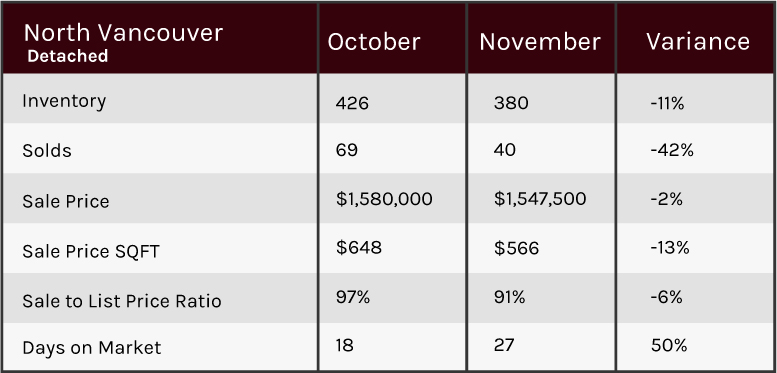
DETACHED
- Buyers Market at 11% Sales Ratio average (1.1 in 10 homes selling rate)
- Homes are selling on average 9% below list price
- Most Active Price Band** $1 mil to $1.25 mil with average 58% Sales Ratio (Sellers market)
- Buyers Best Bet** Homes between $2.5 mil to $2.75 mil, Central Lonsdale, Forest Hills, Lower / Upper Lonsdale and 7 plus bedrooms
- Sellers Best Bet** Selling homes in Boulevard, Deep Cove, Lynn Valley and 3 to 4 bedroom properties
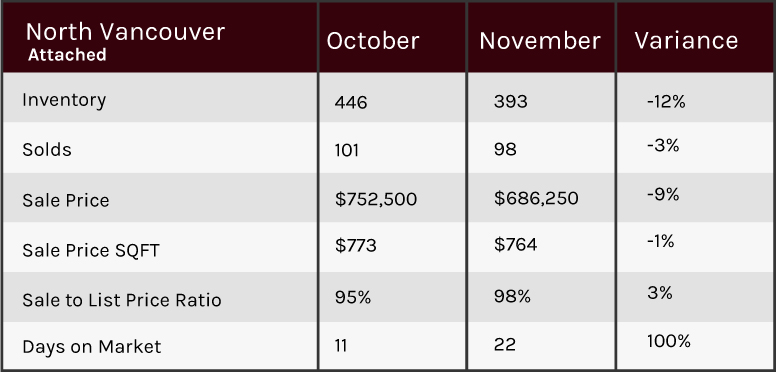
Attached
- Sellers Market at 25% Sales Ratio average (2.5 in 10 homes selling rate)
- Homes are selling on average 2% below list price
- Most Active Price Band** $500,000 to $600,000 with average 47% Sales Ratio (Sellers market)
- Buyers Best Bet** Homes between $1.25 mil to $1.5 mil, Roche Point and 3 bedroom properties
- Sellers Best Bet** Selling homes in Lynn Valley, Nortlands and up to 1 bedroom properties